2018 House Forecating Pre-Election Write-Up
The model results can be found here.
The model methodology is outlined here.
The GitHub repository can be found here.
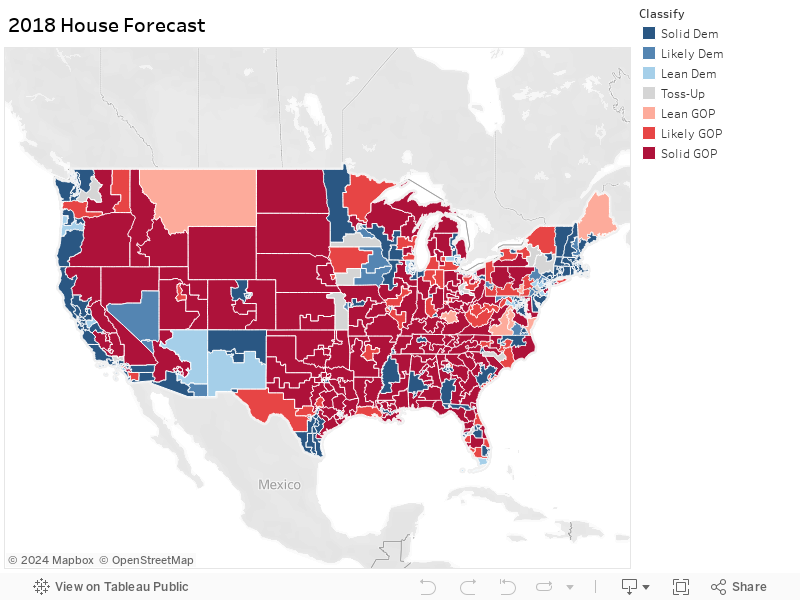
It's Election Eve. All polls released before 7 PM have been entered into the model, and the House Forecast model has been run to generate the final forecast.
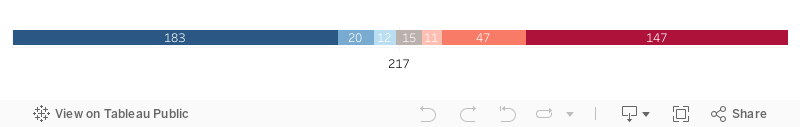
There's a 95% chance Democrats with take control of the House of Representatives, placing them as the overwhelming favorites. The Republican path to maintain the House looks slim - but not impossible.
The national environment has been improving for Republicans as of lately. On November 1st, my generic ballot measure sat at D+8.2. With the final wave of polling, this has fallen to D+7.3. At the same time, polling in close Congressional Districts has moved toward the Democratic candidates.
This raises an important issue not only about my model, but all models. Models are only as good as the inputs they're built on. If the inputs are incorrect, than models will be incorrect. Therefore, you should read my model results as: under the assumptions that the data is correct, Democrats are 95% likely to take the House.
We go into tomorrow assuming the data provided is correct. There is a possibility - though small - that there could be a systematic polling error. It's equally likely the nation could vote more Republican or more Democrat than the given inputs to the model.
This year, I believe there may be a higher probability of a polling error. Siena College partnered with the New York Times this year to conduct Congressional-level polling. In total, almost 100 Congressional-level polls were conducted. While Siena College is a very reputable pollster with a proven track record, that doesn't mean they're immune to a polling error. Because a larger majority of polls were conducted by this one pollster compared to previous elections, this makes forecasting models more reliant on the results of a single pollster. Once again, models are only as good as their inputs, so if Siena College's electorate assumptions are proven incorrect on November 6th, then the models will be off. There's nothing to indicate that Siena College's or any other pollster's results in the model are incorrect; it's just something to be aware of.
Tomorrow night, election results will start rolling in after 6PM. At that time, we should get the first look at a battleground district. KY-06 pits incumbent Andy Barr (R) against Amy McGrath (D). My model currently places this as a Lean GOP district. Amy McGrath has garnered a sizable war chest with which to run ads, but Andy Barr has held slim leads in both Siena College polls of the district. This will probably be our first look at the competing Blue Wave vs. Red Wall theories.
Other early Congressional Districts to watch would include VA-02, VA-05, VA-07, GA-06, GA-07, FL-06, and FL-15. These are all Toss-Up to right-leaning districts. If Republicans look like they will hold all of these districts, then it's possible we won't know who will win control of the House on election night. If Democrats are able to pick off a few of these districts, then it could be a very brutal night for the GOP.
Two other important early districts to watch will be FL-26 and FL-27. These are districts Hillary Clinton won in 2016 while GOP representatives won on the Congressional-level. I believe my model is underestimating Carlos Curbelo's (R) chances in FL-26, ranking it as Leaning Dem, because he is a strong incumbent. FL-27 is quite a Democratic district overall, but the GOP's selection of a popular local news figure as their candidate and what some have called an underwhelming performance by Democrat Donna Shalala may make it possible for the GOP to pull an upset in this blue district.
Around 8 PM, a slew of states will close their polls and massive amounts of votes will start pouring in. It should be evident at this point which way the night will trend. Some congressional districts to watch at this point will be PA-01, NY-19, NY-22, NJ-03, NJ-07, ME-02, MI-08, KS-02, KS-03, TX-07, and TX-32. I'll be watching districts like PA-01 and NJ-03 to determine the GOP's chances of keeping the House. Both of these districts are part of my I-95 Corridor cluster; they're more suburban, well-educated, and wealthier. If Republicans are able to hold on to these two districts, they may have a path to keeping the House. If they don't, it seems really unlikely in my mind how they would get to 218 seats.
As the night goes later, some CDs I'll be watching are MN-01, MN-02, MN-03, MN-08, UT-04, CA-25, CA-39, CA-45, CA-48, NM-02, WA-03, and WA-08. If we get past the East Coast, and it looks like Republicans still have a chance of holding the House, these districts will probably be the most crucial in determining control.
What if there is a Blue Wave? If there's a Blue Wave, I would expect some of those early right-leaning districts in VA and FL to fall to Democrats, such as VA-07, a Richmond suburb district. If that's the case, you might see some surprising flips, like a PA-10 or MI-06. In this case, expect Democrats to pick up 40+ seats.
What if there is a Red Wall? If there's a Red Wall, I would expect Republicans to hold all those VA and FL right-leaning districts. You might even get a surprising flip in FL-07, where the Democratic incumbent should easily win, but there's only been one poll conducted there and the Republican looks to be within striking distance. AZ-01 and NV-04 might be in play for Republicans if this is the case. I'd still expect the GOP to lose seats overall though.
Overall, I'm very pleased with how my model performed. It's been quite consistent since launch. However, for the final time, models are only as good as inputs; they are simplified versions of our world. I'd like to call out a few districts I think are incorrectly classified. ME-02 is a Lean GOP district; I would classify it as a Toss-Up. FL-26 is a Lean Dem district; I would classify it as a Toss-Up. NM-02 is a Lean Dem district; I would classify it as a Toss-Up. IL-06 is a Lean Dem; I would classify it as a Toss-Up. UT-04 is a Likely GOP; I would classify it as a Toss-Up. Finally, I did all my input build testing on Mimi Walter's (R) CA-45 district. It's classified as a Lean Dem district; I would classify it as a Toss-Up.
While I'm pleased with the model, I do have new ideas for the next implementation of this model that I believe will improve its performance. The first is the use of raw dollar amounts in the model. I wasn't anticipating some Democratic candidates to completely shatter fundraising records when I was originally building the model. Due to the diminishing marginal returns of campaign finances, I'd like to test using logged monetary amounts instead of raw dollars in the next implementation.
Additionally, I'd like to account for the possibility of a systematic polling error and applying a measure similar to an elasticity when generating the predicted vote share in the next model implementation. This would be done by developing an elasticity score for each congressional district, and how much the predicted vote share moves relative to the generic ballot will be based on this elasticity score. For the simulations, I would like to build a confidence interval around the generic ballot and randomly sample from this in order to conduct the simulation. This would help account for the possibility of a systematic polling error in the model because all Congressional Districts within that simulation would be part of the same national environment, which was sampled from that generic ballot confidence interval.
That wraps up my 2018 House Forecast model. See you in 2020.