2018 House Forecating Model Methodology
The model results can be found here.
The pre-Election write-up can be found here.
The GitHub repository can be found here.
Data Preparation
Using FEC data, Congressional Districts since the 2008 Election were clustered based on their principal components of various demographic, socio-economic, and electoral factors. Principal Component Analysis (PCA) allows the large variable set to reduce in size while still maintaining almost all the information of the original data. Using the seven best principal components, the Congressional Districts were then divided into seven different clusters, which can be seen below.
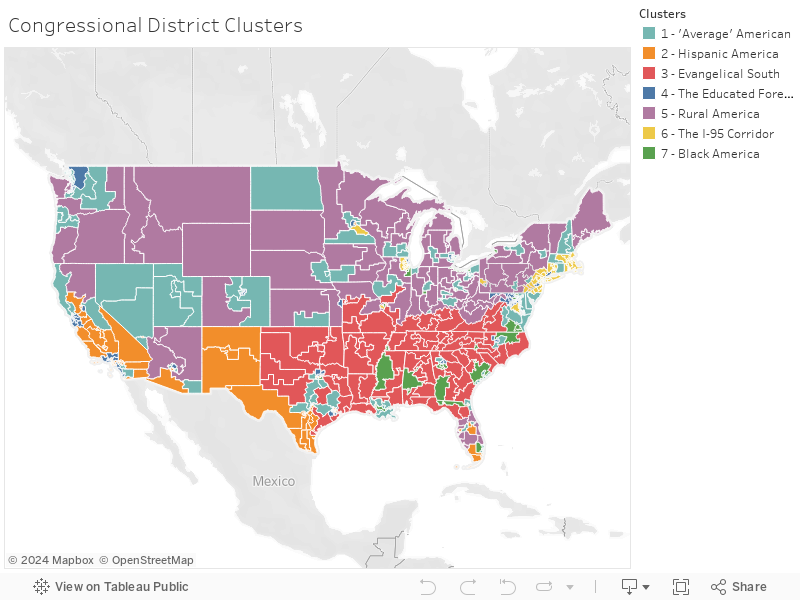
"Average" America contains Congressional Districts that generally center around the mean - or average - for almost all the demographic, socio-economic, and electoral factors.
Hispanic America contains Congressional Districts that are generally more Hispanic. They also skew younger, have a higher percent of foreign born residents, a higher percent living below the poverty line, and are more Catholic than other Congressional Districts.
Evangelical South contains Congressional Districts in the South with a higher percent of Evangelicals. These districts are also more rural, have a higher percentage of veterans, have a higher percentage of people living below the poverty line, and vote more Republican than other Congressional Districts.
The Educated Foreigners contains Congressional Districts that have a higher percentage of foreign born residents, have a higher percentage of residents with higher education degrees, and generally have a higher average income than other Congressional Districts.
Rural America contains Congressional Districts that are generally whiter, more rural, and have fewer foreign born residents. These Congressional Districts also have higher percentages of veterans and have less residents that belong to a set religious denomination compared to the others.
The I-95 Corridor generally contains Congressional Districts located in the Northeast along I-95 - though there are some exceptions like PA-17, MN-02, and many Congressional Districts located in Chicago's western suburbs. These Congressional Districts tend to have higher median incomes, more residents with higher education, and are more religious, specifically Catholic.
Black America contains Congressional Districts that generally have more black residents than the typical Congressional District. These tend to be younger, have a lower percentage of married residents, have a higher percent of residents living below the poverty line, and vote less Republican.
Looking within each cluster, each Congressional District is matched to its 10 closest neighbors. Since we expect similar Congressional Districts to generally move together, these 10 closets neighbors will help predict an expected vote share for Congressional Districts with no polling or light polling.
Features for the Model
Features in the model span some demographic and economic variables from the cluster builds as well as FEC data, such as individual contributions, cash on hand, and party PAC support, as well as national environment variables, such as the generic ballot, PVI, and this year's predicted results.
This Year's Predicted Results: This year's predicted results are built off a Congressional District's polling information, the polling information of its neighbors, and a "baselined" election result adjusted for the generic ballot. As more polling becomes available for a district and its associated districts, this year's predicted result value becomes increasingly reliant on these polling values and the "baselined" prediction is gradually phased out at the same rate. When there's enough polling information for a Congressional District, the polling will make up the entire predicted result. For districts with little polling and little associated districts with polling, the results are more reliant upon a "baselined" results - defined as the expected vote in a hypothetical year where the generic ballot gap is 0 - adjusted for the national environment. For Congressional Districts with no prior election results and no results for similar Congressional Districts - i.e. many of PA's new Congressional Districts - the "baselined" results are imputed using a linear regression model, built using the same variables to build the clusters as well as the adjusted PVI value.
The Model
There are many ways to model the winner of the each Congressional District. I opted to model the election result's gap. I define gap as: GOP result percentage - Dem result percentage. Therefore, the Republican candidate is the winner if the gap is greater than zero and the Democratic candidate wins for any value less than zero.
A random forest is a top-performing ensemble model for machine learning. My random forest builds 1,000 "weak learning" decision trees. Typically, a random forest averages these weak learners to form the predicted ensemble value. Instead, I take all the predictions of each of the 1,000 decision trees to form the distribution of results for each Congressional District. This still maintains the top-line output of the individual results from the random forest, while also providing a sampling set from which to run simulations.
After running the random forest, I simulate the expected results of the model by randomly sampling the 1,000 outputs for each Congressional District. Averaging across the simulations gives the probabilities for the Republican and Democratic candidates for each district. Summing the results of the simulation provides a predicted number of House seats each party wins. Counting the number of simulations the Republicans and Democrats win a majority of seats in the House of Representatives (>217), provides the final probabilities for each of the parties taking control of the House.
The one downside of modeling the results this way is that summing the simulation results of the random forest assumes the results of congressional districts are not correlated - which is not the case in real life. If the national environment turns out to be more Republican or Democratic than the generic ballot, then many districts should be correlated in falling one way or the other. The only way this assumption holds is when the actual national environment matches that of the generic ballot. This is one shortcoming I wish to fix in the future.